
If you use a shared computer, you surely have noticed it before that someone forgot to clean their cookies and history and you were…

If you use a shared computer, you surely have noticed it before that someone forgot to clean their cookies and history and you were…
Aside from deleting your temporary internet files, you should be aware of the index.dat, which has been spying on you and your browsing behaviour…
If you want your PC to be more private and secure read through our NSA-proof PC guides (8 parts so far). In this part,…
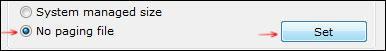
Disabling the swap file in Windows or changing its size is really simple and most of you will already know how to do it…
If you want to add your PC to your list of allowed Wifi machines e.g. in your router software, you will need your MAC…
DMP files (dump files) are useful for debugging Windows, so you should know how to open and read DMP files in Windows 7 or…
You should try to repair/reset Winsock in Windows if you are having problems with your network controller. I’m having some major problems with my…
Do you need know how to repair corrupt system files? If your system is broken and you can’t even start Windows, you will have…
A lot of computer programs require your clocks to be correctly synchronized for all sorts functions that rely on timestamps. Let’s take a quick…
Although Microsoft is making progress on making the installation process easier, there are still many upgrade issues, including cryptic error message like “Setup has…
To get used to a new interface you should try some of the new features Microsoft’s browser Edge has to offer. In this guide…
If you can’t change the display language, here are some troubleshooting tips that will help you to change the display language to English or…
If you have stored a lot of files in various subdirectories and you don’t have time to move them up manually which could take…
You want to customize your PC? How about adding new items to your context menu, e.g. notepad++, Firefox, Steam or any other program?
Windows has a lot of built-in shortcuts, some of them will give you access to more context menu items and additional “send to” items.